
GOITWIC Chronicler

darktrial
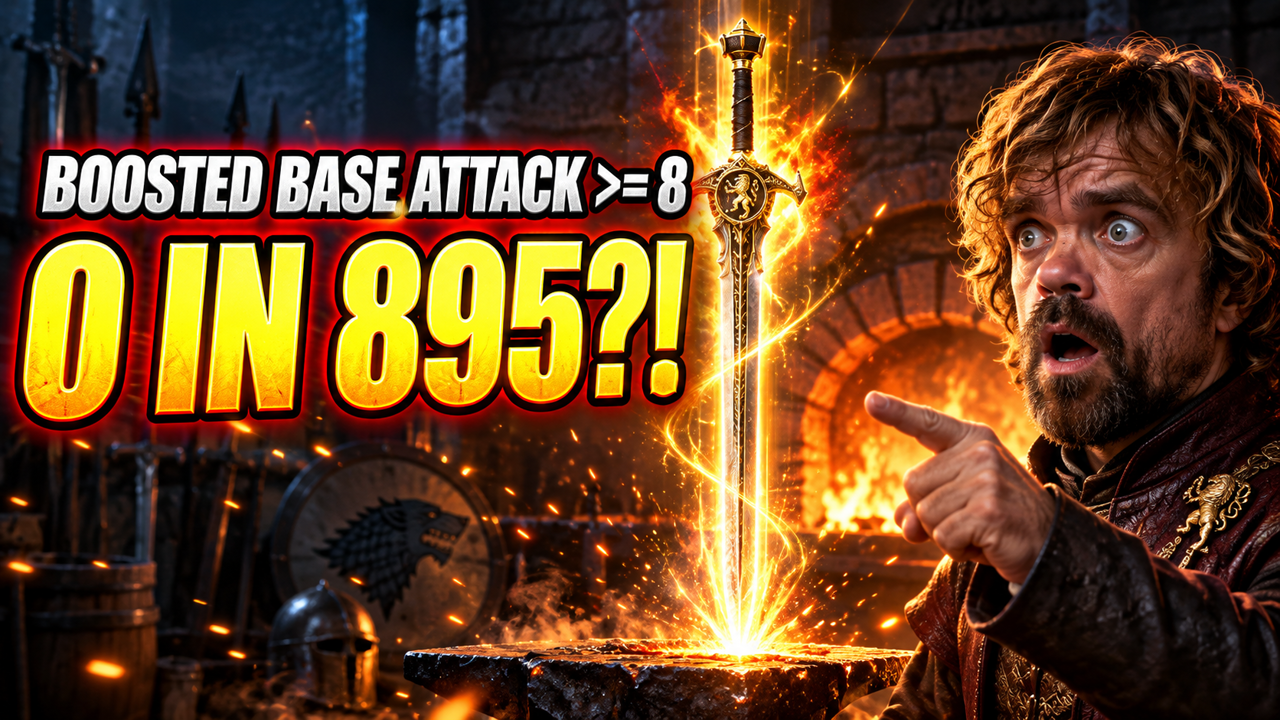
Weapon reforging can consume a large amount of material without making it clear how often a desirable attribute will actually appear. To get a practical estimate, I reviewed two weapon-reforge recordings that used the same weapon, the same reforging system, and the same target attributes.
The two recordings were combined into one statistical sample:
SourceValid reforges
Video 1:432
Video 2:463
Combined sample: 895
Each completed reforge was treated as one independent observation. Every result screen was readable, so no sample had to be excluded as uncertain.
Important: These figures are empirical estimates from the recorded sample. They are not official game probabilities, and they should not be interpreted as guaranteed drop rates.
What Was Measured?
The analysis tracked two random weapon attributes:
- Boosted Infantry Base Attack
- High tier: value >= 8
- Lower tier: value < 8
- Reduced Enemy Cavalry Damage vs. Allied Infantry
- High tier: value >= 6.4%
- Lower tier: value < 6.4%
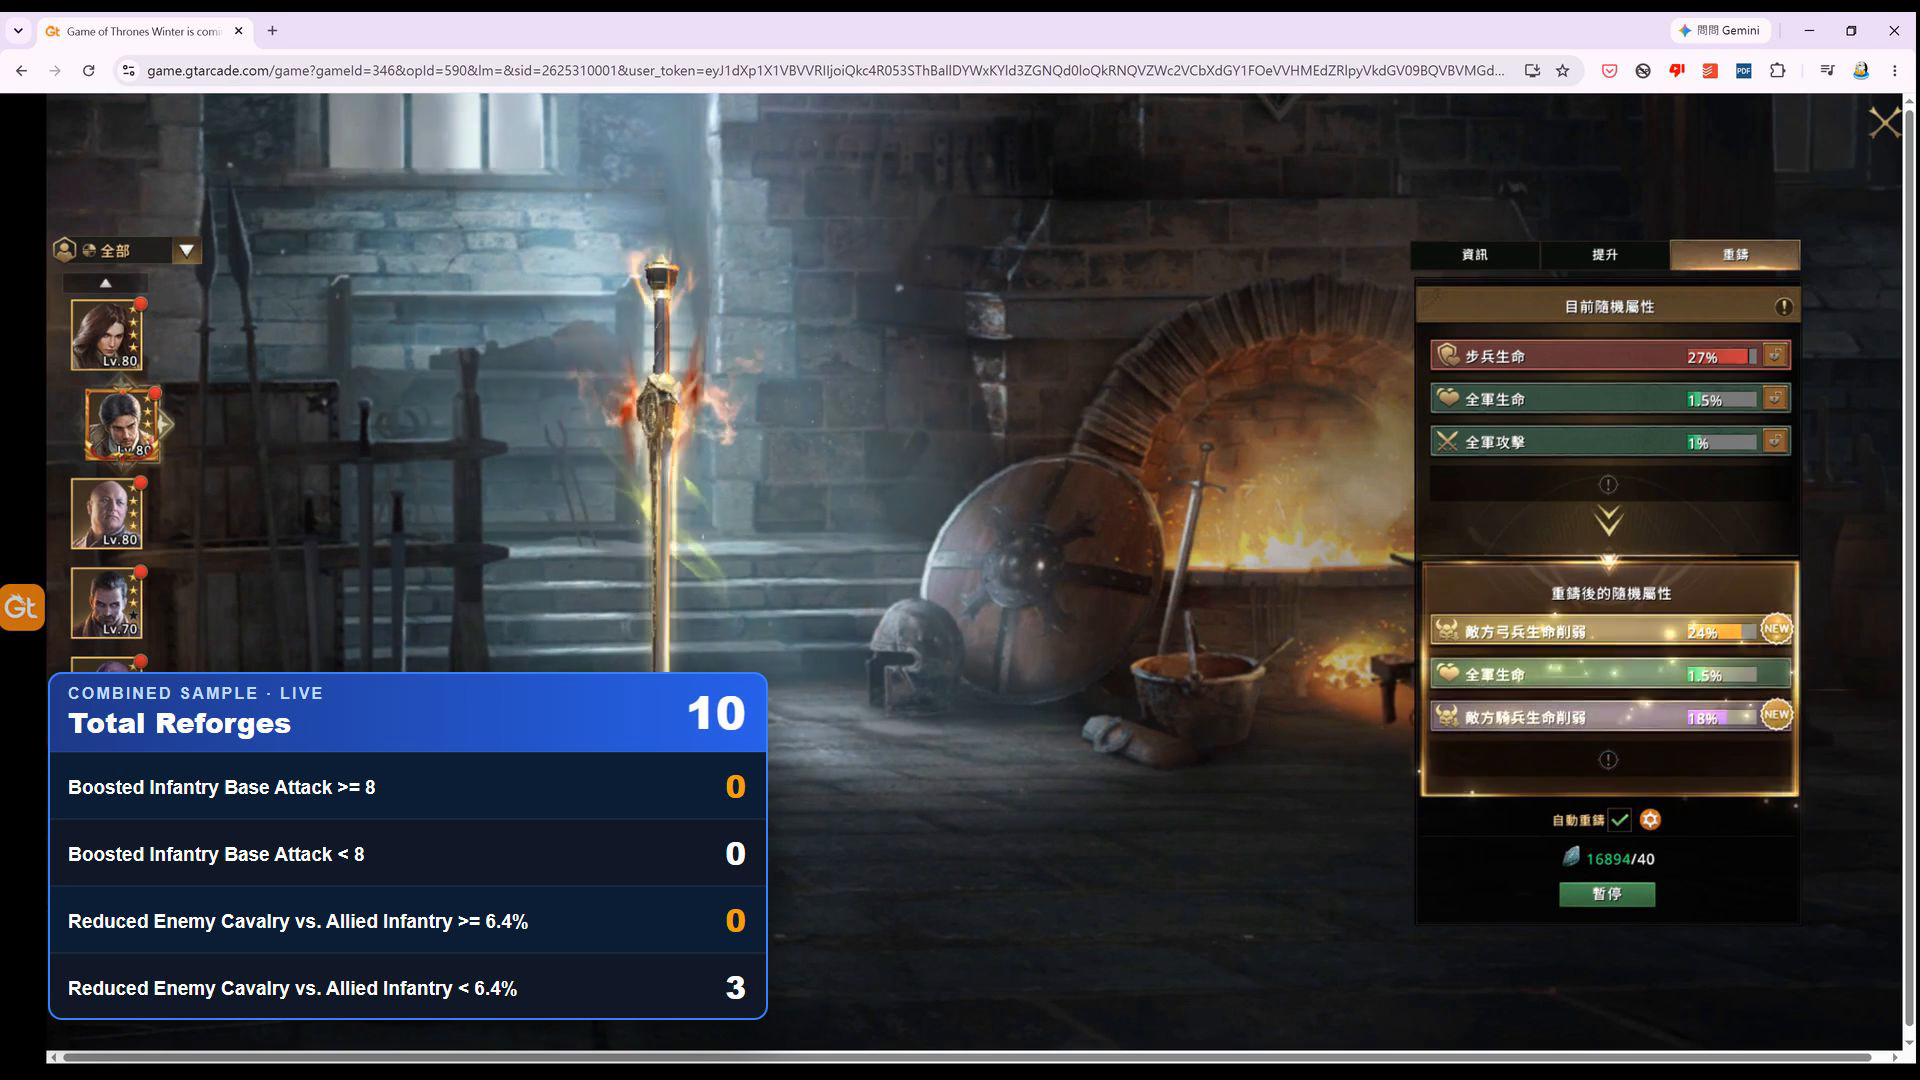
A frame from the recorded test. The overlay counts results across both videos as one combined sample.
Main Results
Boosted Infantry Base Attack
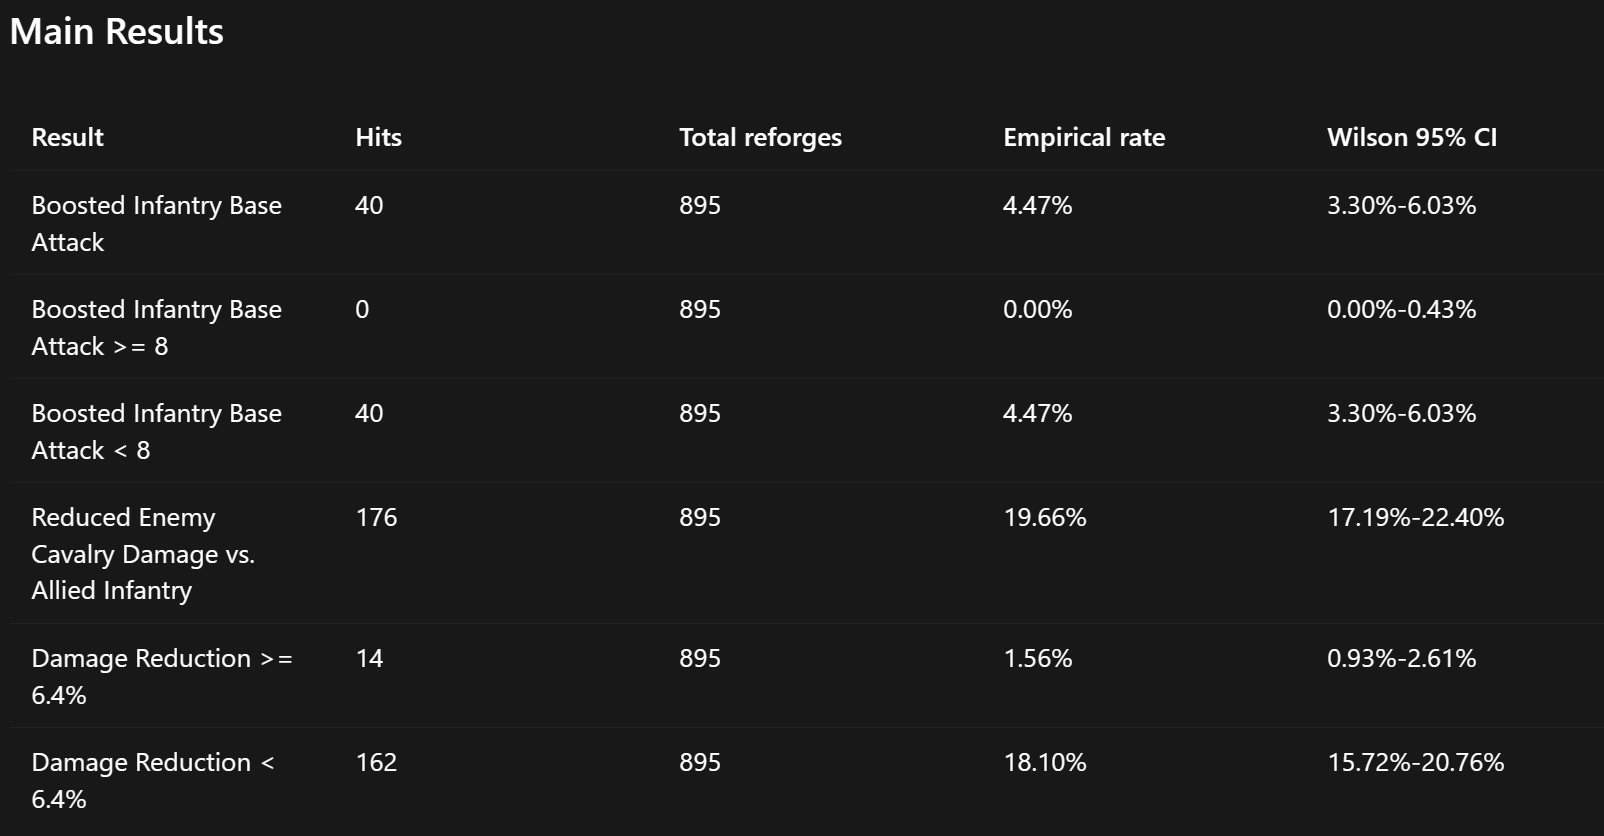
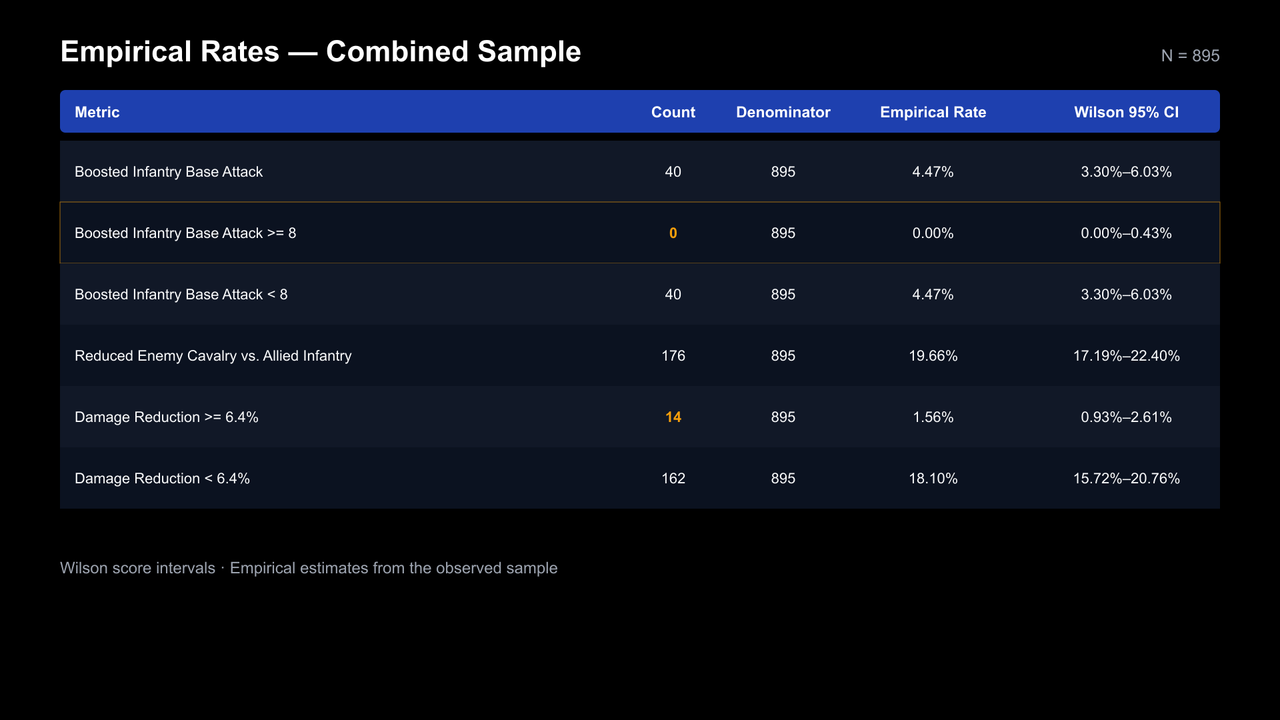
Boosted Infantry Base Attack appeared 40 times in 895 reforges, producing an empirical rate of 4.47%. In practical terms, the point estimate is approximately one appearance per 22 to 23 reforges.
The observed values were:
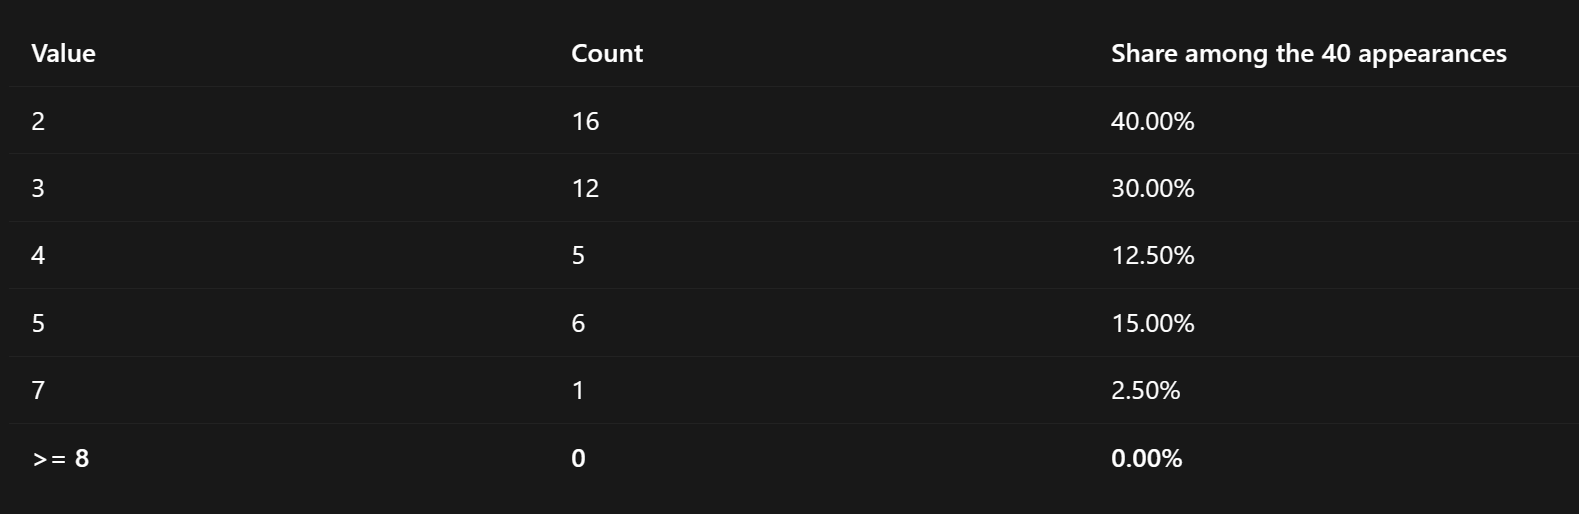
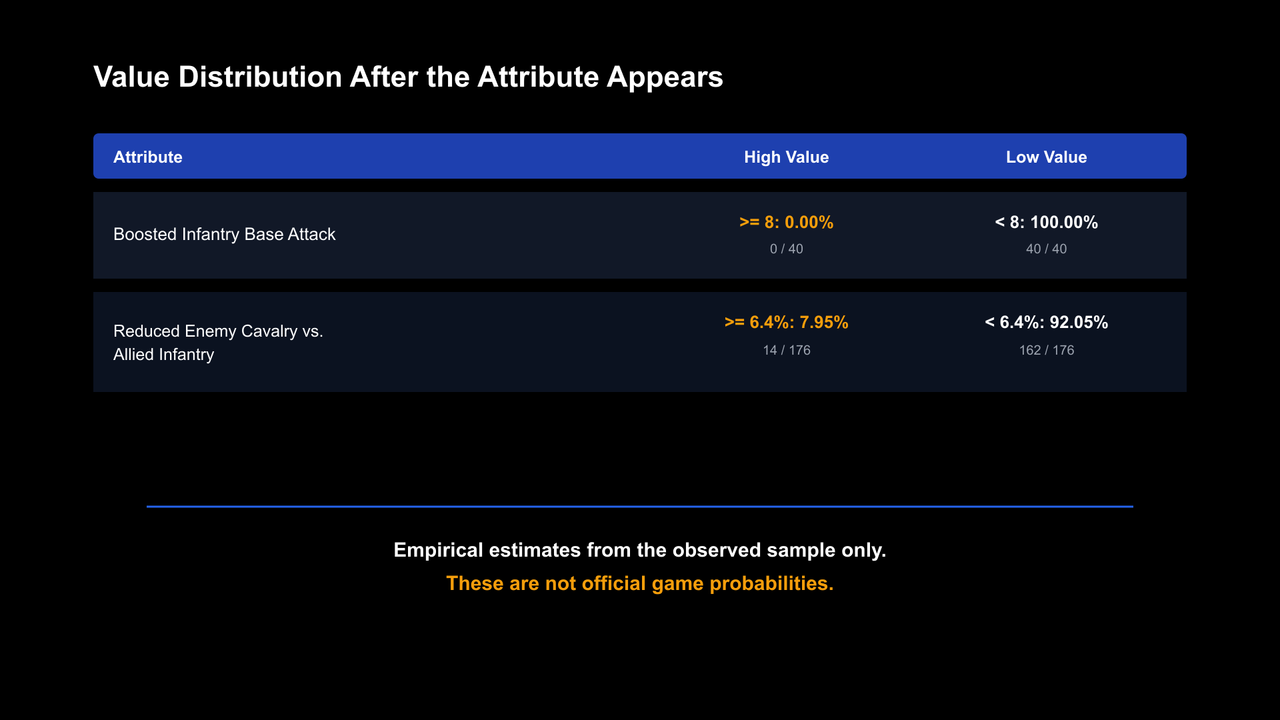
The important result is that none of the 895 reforges produced Boosted Infantry Base Attack >= 8. All 40 observed appearances were below 8.
However, 0 out of 895 does not prove that the real probability is zero. The Wilson 95% confidence interval is 0.00%-0.43%. The sample therefore supports the conclusion that the result is very rare, but it cannot determine exactly how rare it is.
Reduced Enemy Cavalry Damage vs. Allied Infantry
This attribute appeared 176 times, giving an empirical rate of 19.66%, or approximately one appearance per 5 reforges.
Its observed value distribution was:
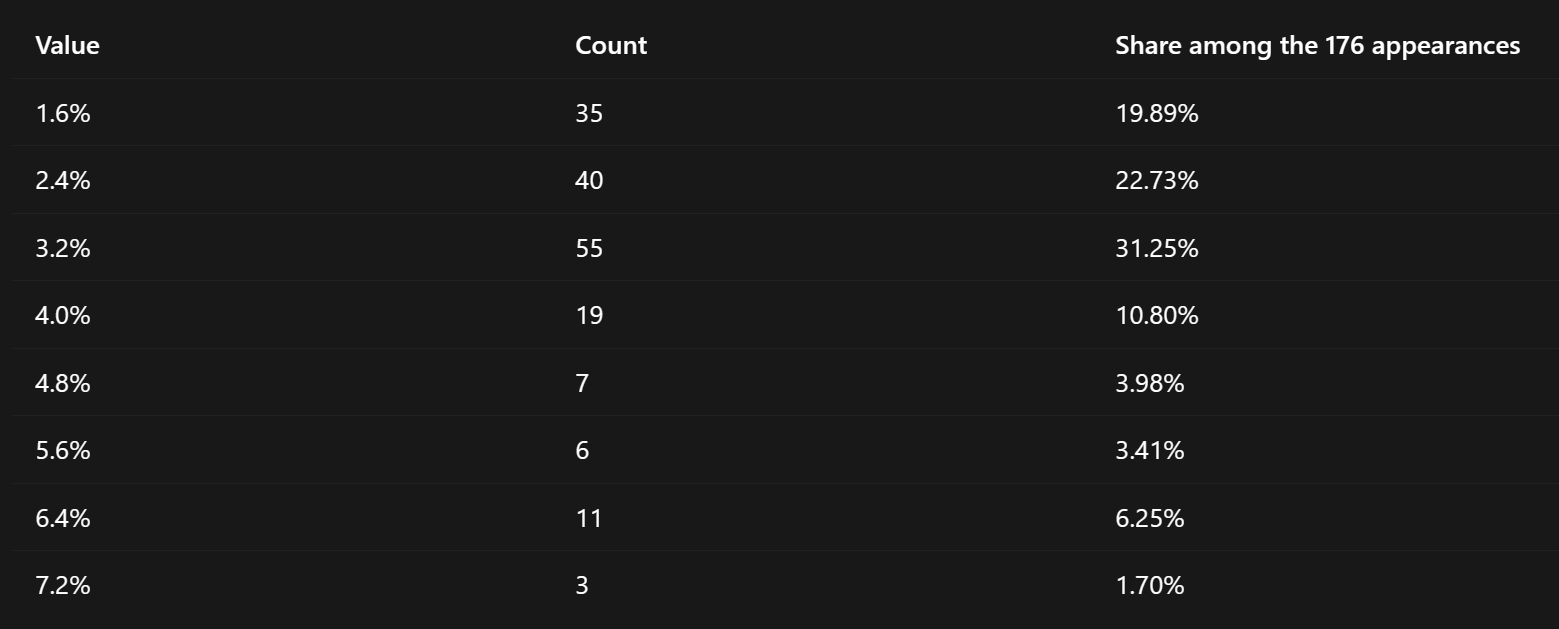
High-tier values of 6.4% or 7.2% appeared 14 times in 895 reforges. That is a direct empirical rate of 1.56%. After the attribute appeared, the chance that its value was at least 6.4% was 14/176 = 7.95%.
How Many Reforges Might Be Needed?
For an event with per-reforge probability p, the probability of seeing it at least once after n independent reforges is:
P(at least one success after n reforges) = 1 - (1 - p)^n
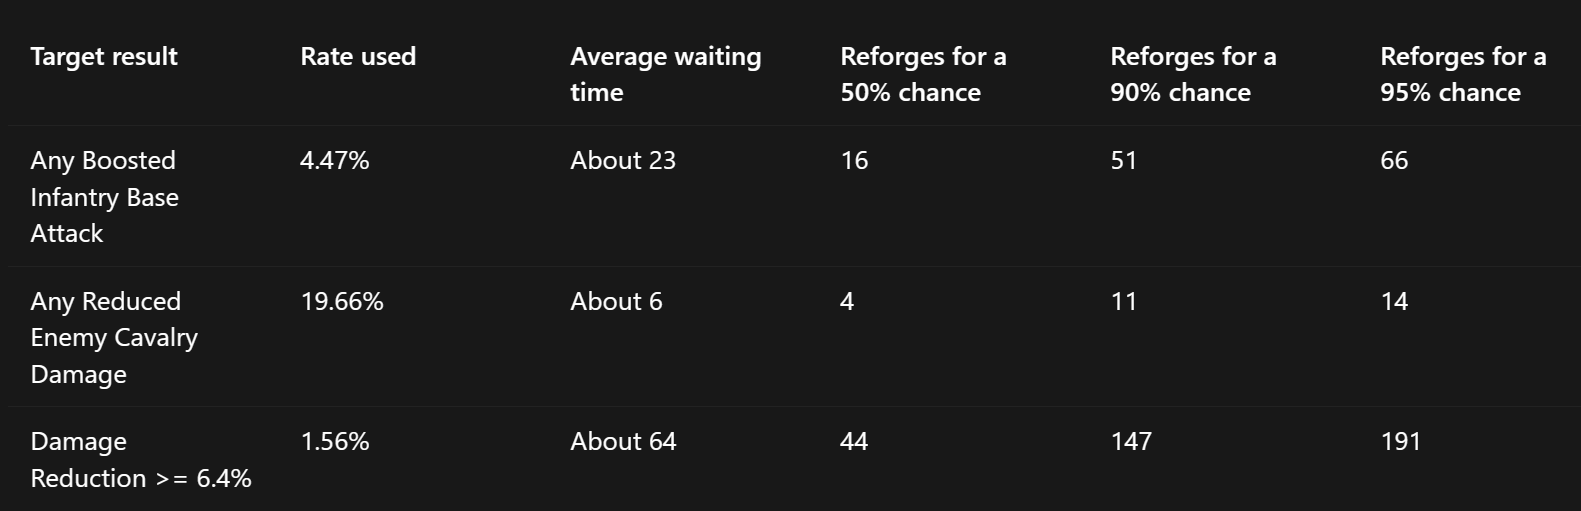
The following estimates use the observed empirical rates as if future reforges behave like the recorded sample. They are planning estimates, not guarantees.
Practical estimate for Damage Reduction >= 6.4%
Based on the point estimate, a player would need approximately:
- 44 reforges for a 50% chance of seeing at least one high-tier result.
- 64 reforges as the average waiting time.
- 147 reforges for a 90% chance.
- 191 reforges for a 95% chance.
The 95% confidence interval for the per-reforge probability is 0.93%-2.61%. If the true rate is near the low end, the average wait would be about 108 reforges; near the high end, it would be about 39 reforges. This range shows why a run of 100 attempts may feel successful for one player and disappointing for another.
Practical estimate for Boosted Infantry Base Attack >= 8
There were no successes, so the sample does not support a finite point estimate for the average waiting time. Dividing by the observed rate would mean dividing by zero, which is not a useful prediction.
The upper edge of the Wilson 95% interval is approximately 0.43%. If the real probability were as high as that upper edge, the numbers would still be roughly:
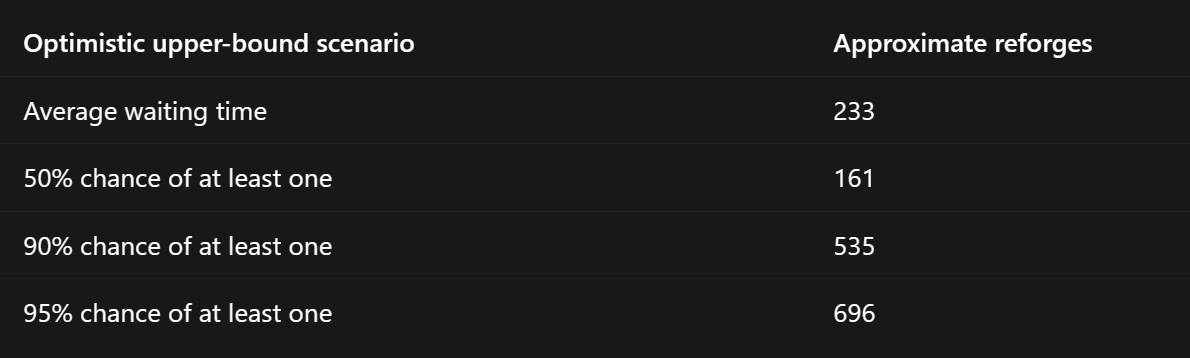
This is an optimistic rarity scenario, not an estimate of the true rate. The real probability may be lower, in which case the required number of reforges could be much larger. The most defensible conclusion is therefore:
Plan for several hundred reforges if Boosted Infantry Base Attack >= 8 is the only acceptable result, while recognizing that even several hundred attempts may not be enough.
What the Confidence Intervals Tell Us
The sample is reasonably informative for the common 19.66% attribute because it appeared 176 times. Its confidence interval is relatively narrow.
The sample is less precise for the 1.56% high-tier damage-reduction result because only 14 successes were observed. Its true probability may plausibly be closer to 1% or closer to 2.6%.
The sample cannot precisely estimate Boosted Infantry Base Attack >= 8 because it never appeared. A larger dataset is needed to distinguish between an extremely rare result and a result that is unavailable under the tested conditions.
Player Takeaways
- Any Boosted Infantry Base Attack appeared about once every 22-23 reforges, but every observed value was below 8.
- High-tier Damage Reduction >= 6.4% appeared about once every 64 reforges on average.
- Around 147 reforges would provide an estimated 90% chance of at least one Damage Reduction >= 6.4% result, assuming the observed rate remains stable.
- Boosted Infantry Base Attack >= 8 appears substantially rarer. The data supports budgeting hundreds of attempts, not expecting a quick result.
- No fixed attempt count can guarantee success in an independent random system.
Limitations
This analysis assumes that each recorded reforge is independent and that the game did not change the underlying probabilities between the two recordings. It also assumes that weapon type, locks, account state, and other hidden conditions do not alter the relevant rates.
Only the developer can publish the true probability table. Until then, the results should be described as empirical rates, sample estimates, or estimated probabilities.
References
- GTArcade: Commander Weapon System
- GTArcade: Main Hand Weapon Locking Guide
- GTArcade: Mainhand Weapons and Reforging
- How Rare Is Boosted Infantry Base Attack ≥ 8? | 895 Reforges Tested
Dataset: two recordings, 895 valid reforges in total. Confidence intervals: Wilson score intervals at the 95% level.
Translate

Popular Posts
1

Fhfkwd
53 discussions 92 views
2
Kaamwe
38 discussions 88 views
3

Angriffe ohne Grund..!!
55 discussions 122 views